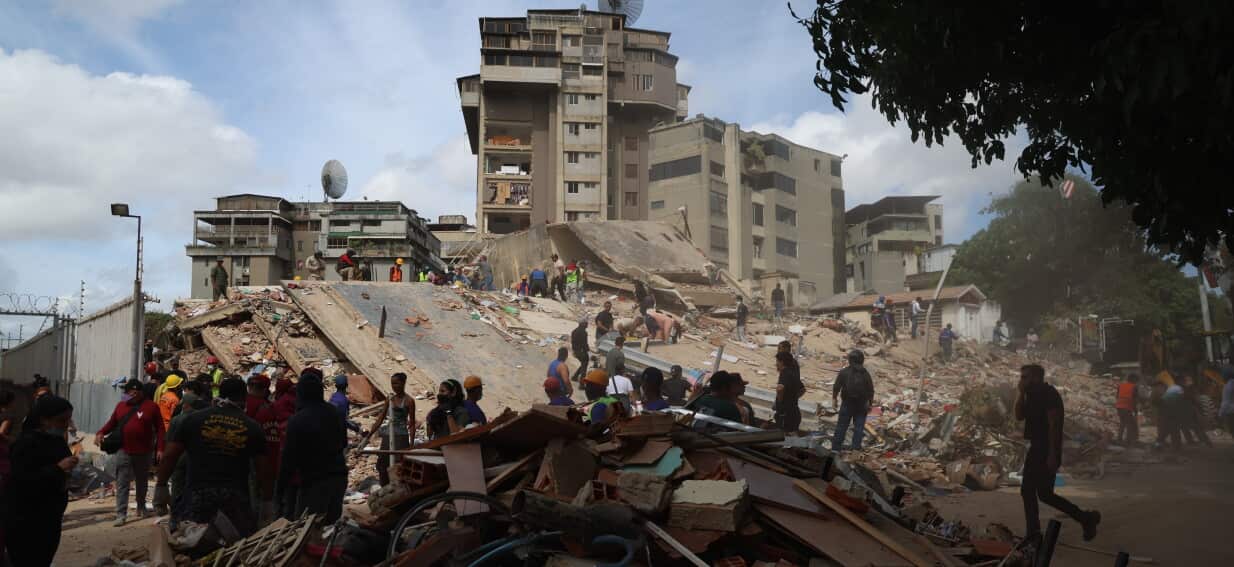
The issuance of more than 60,000 automated red-light camera citations by the Calgary Police Service since 2024 exposes a profound disconnect between administrative enforcement volume and systemic behavioral modification. While a gross volume of 60,000 infractions—including approximately 8,400 occurrences captured between January 1 and May 31 of this year—signals a massive scale of operational deployment, it simultaneously highlights a failure in structural deterrence. At a fixed penalty of $405 per infraction, this system has generated upwards of $24.3 million in gross financial liabilities. Yet, the persistent rate of violations raises critical questions about the mechanics of automated traffic enforcement, the economics of driver incentives, and the structural limitations of municipal infrastructure design.
To understand why a high volume of citations fails to permanently suppress hazardous driving habits, the phenomenon must be broken down into its core operational, financial, and structural components.
The Deterrence Asymmetry Framework
The fundamental objective of any punitive municipal system is behavioral deterrence. In traffic enforcement, deterrence relies on the perceived probability of detection multiplied by the severity and nature of the penalty. The current automated framework utilized by the Calgary Police Service suffers from an architectural asymmetry that fundamentally alters how drivers process the risk of running a red light.
The Decoupling of Financial Liability and Operational Risk
Under the Alberta Traffic Safety Act, Automated Traffic Enforcement (ATE) notifications via Intersection Safety Cameras (ISCs) are issued exclusively to the registered owner of the vehicle, rather than the verified operator. This legal reality necessitates a specific compromise in enforcement mechanics:
- Zero Demerit Point Accumulation: Because the identity of the driver cannot be verified by an external optical sensor capturing the rear license plate, no demerit points can be legally assessed against the operator’s license.
- Insulation from Insurance Risk: Because demerit points are absent and the infraction is logged as an administrative vehicle owner liability, these citations do not alter the owner’s driver abstract or affect actuarial risk calculations by private insurance underwriters.
This structure creates an economic environment where the penalty is converted from a legal deterrent into a transactional expense. For high-income demographics, a $405 fine functions as an occasional cost of transit rather than a punitive measure capable of forcing behavioral correction. The psychological mechanism of deterrence shifts from an existential threat to driving privileges down to a simple cash-flow calculation.
[Vehicle Enters Intersection Post-Red]
       │
       ▼
[Optical Capture of License Plate]
       │
       ▼
[Administrative Liability Assigned to Owner Only]
       │
       ├─► No Demerit Points Assessed
       └─► Insurance Premiums Unaffected
The Network Coverage Disparity and Probability Modeling
A critical failure point in relying on automated systems to alter city-wide driver behavior is the sheer mathematical limitation of the deployment footprint.
The Under-Five-Percent Bottleneck
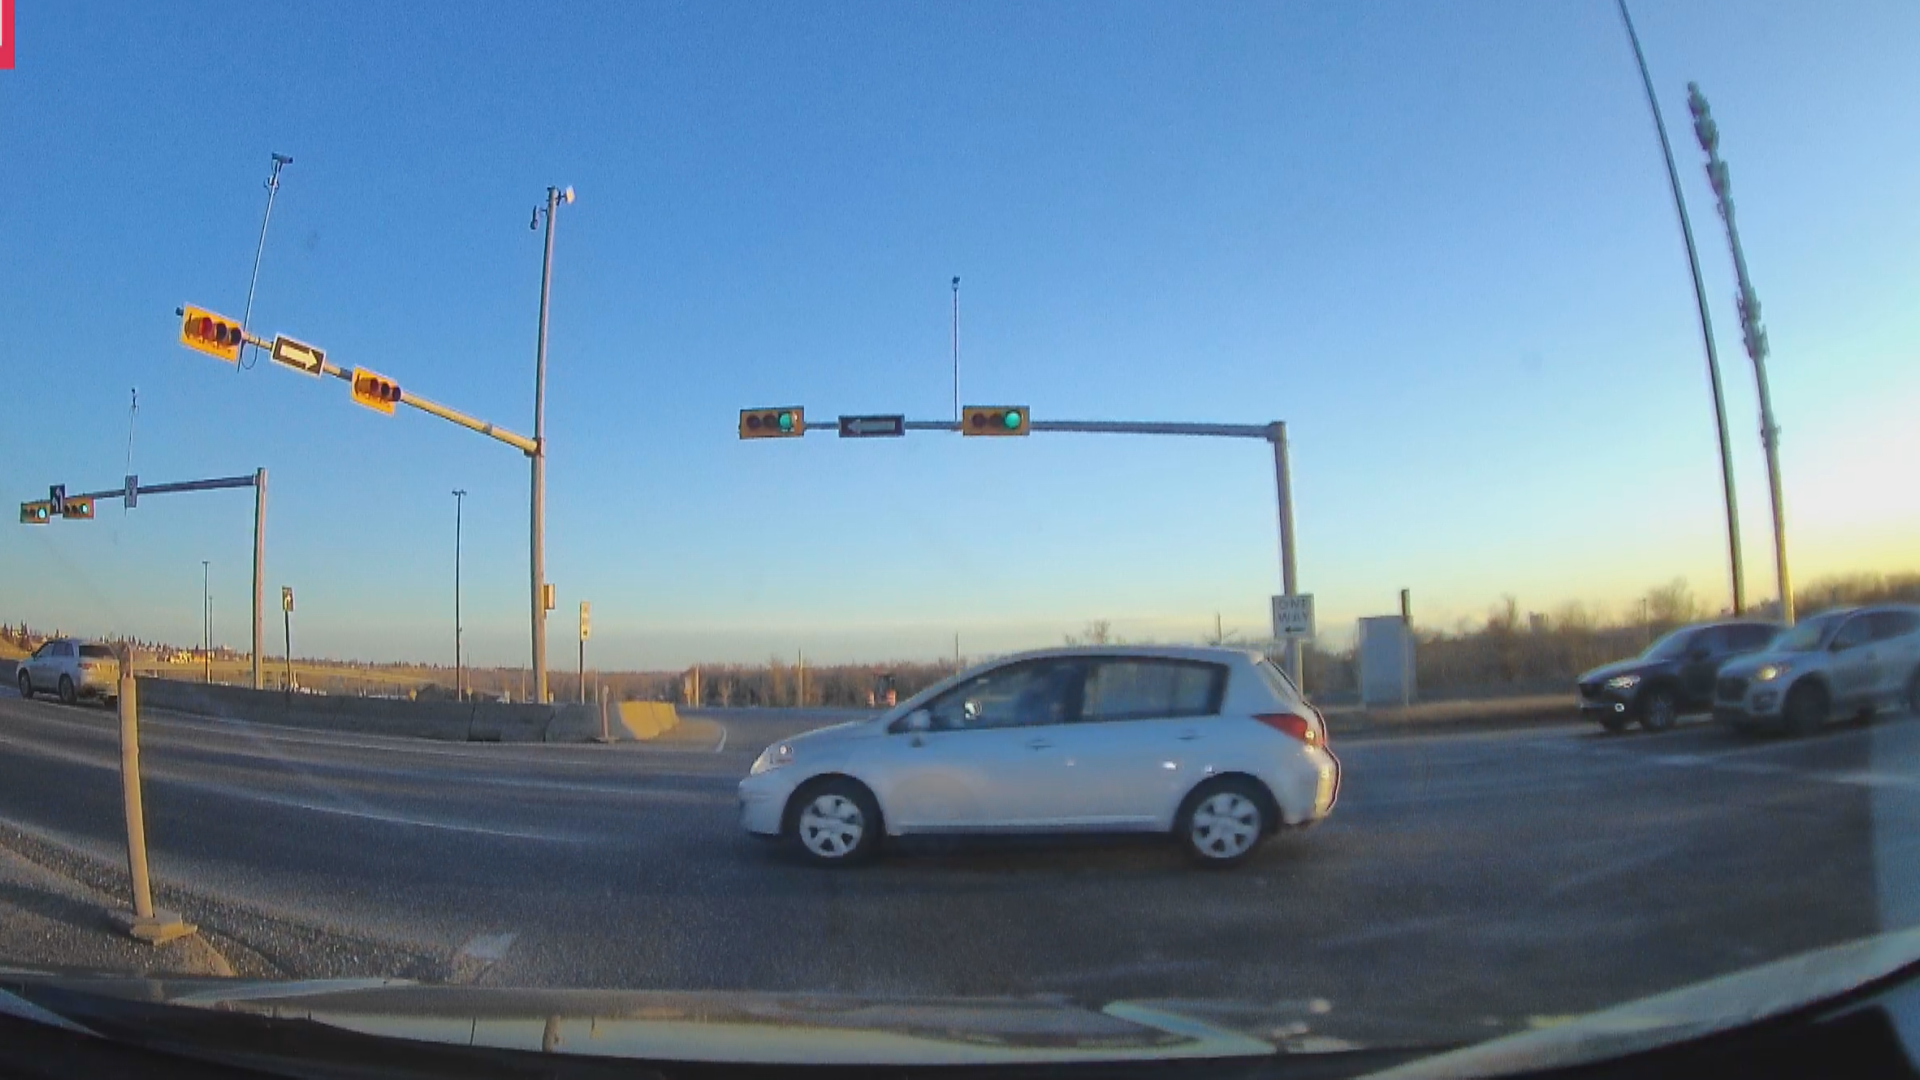
Calgary currently operates 57 active Intersection Safety Cameras. According to municipal transit and civil engineering assessments, these 57 units monitor fewer than five percent of the total signalized intersections across the municipal grid. This sparse distribution introduces a predictable calculation among habitual violators, which can be modeled using basic probability and game theory principles.
If an individual commutes through an urban environment with a high density of non-camera intersections, the mathematical probability ($P$) of encountering an active enforcement mechanism on any given random path approach is low. Let $N_{total}$ be the total number of signalized intersections, and $N_{active}$ be the number of monitored intersections:
$$P(Detection) = \frac{N_{active}}{N_{total}} < 0.05$$
Because the probability of detection is localized to a miniscule fraction of the urban grid, drivers quickly develop localized compliance habits. They decelerate and obey signals precisely at known camera coordinates—often marked clearly by safety signage or community crowd-sourced navigation applications—while reverting to high-risk, time-saving behaviors at the remaining 95 percent of unmonitored intersections.
The structural consequence is not a macro-level reduction in aggressive driving, but a hyper-localized displacement of risk. The system implicitly trains drivers where to comply, rather than teaching them how to safely approach intersections globally.
Regulatory Friction and the Speed-on-Green Constraint
The trajectory of automated enforcement data in Calgary cannot be analyzed without factoring in the macro-level policy shifts dictated by provincial authorities. The operational environment changed markedly following the December 2024 provincial mandate, which imposed strict boundaries on municipal automated enforcement.
The Removal of Dual-Function Enforcement
The provincial framework implemented restrictions that effectively dismantled "speed-on-green" automated enforcement mechanisms on major corridors and provincial highways within municipal boundaries, limiting automated devices strictly to red-light non-compliance or designated school, playground, and construction zones.
This policy shift disrupted the holistic enforcement of intersection safety. Historically, speed-on-green capabilities targeted the specific acceleration curve that occurs when a driver attempts to "beat" a transitioning amber phase. By stripping away the automated speed component at the majority of intersections, the provincial regulation altered the driver's risk matrix:
- Elimination of Velocity Penalties: A driver approaching a transitioning light knows they will not face an automated speeding ticket for accelerating through the amber window.
- Compression of Decision Windows: Drivers are incentivized to increase their velocity to clear the loop sensor before the absolute red phase initiates.
- Increased Boundary Failures: When the driver's velocity calculation is slightly flawed, they enter the intersection milliseconds after the red phase has activated, triggering the 60,000+ red-light tickets logged by the remaining active systems.
The sharp volume of citations is therefore a lagging indicator of an engineering and regulatory environment that unintentionally incentivizes drivers to accelerate during signal transitions, escalating the probability of high-severity T-bone collisions.
The Infrastructure Deficiency and Civil Engineering Factors
To attribute 60,000 red-light violations entirely to driver malice or carelessness ignores the role that roadway geometry, signal timing, and civil infrastructure play in dictating human behavior. Data from civil engineering departments suggests that intersection non-compliance is frequently an engineering failure masquerading as a legal infraction.
Yellow Light Duration and the Dilemma Zone
A driver approaching an intersection faces a critical spatial window known as the "Dilemma Zone." This occurs when the traffic signal transitions from green to yellow, and the driver is at a distance where they can neither comfortably stop before the stop bar using standard deceleration rates nor clear the intersection before the signal turns red.
The duration of the yellow phase is calculated based on approach speeds and average brake reaction times:
$$t = t_{reaction} + \frac{v}{2a + 2Gg}$$
Where $v$ represents the approach velocity, $a$ is the comfortable deceleration rate, $G$ is the roadway grade, and $g$ is the acceleration due to gravity.
When municipal traffic divisions fail to adjust yellow light timings to match actual 85th-percentile operating speeds—as opposed to arbitrary posted speed limits—the Dilemma Zone expands. Drivers traveling at realistic urban flows are mathematically trapped. If they apply heavy braking, they risk being rear-ended by trailing vehicles; if they maintain momentum, they trip the automated camera sensor.
The occurrence of 8,400 tickets in a five-month span during early 2026 indicates that instead of modifying behavior, the system is actively capitalizing on fixed timing parameters that do not accommodate real-world road conditions, fluctuating seasonal traction, or driver reaction variances.
Re-Engineering the Deterrence Paradigm
Maximizing urban safety requires moving away from passive administrative revenue generation and toward dynamic, structural enforcement protocols. The reliance on 57 fixed cameras capturing rear license plates is an outdated operational posture. To achieve systemic compliance, a municipal strategy must execute on three distinct levels.
Implement Dynamic All-Red Clearance Intervals
Rather than relying on post-infraction financial penalties to deter future acts, intersections must be engineered to prevent immediate kinetic impacts. Extending the all-red clearance interval—the brief period where all approaches to an intersection display a red signal simultaneously—based on real-time radar detection of high-velocity approaching vehicles eliminates the immediate collision vector of a red-light runner.
Expand Point-to-Point Average Speed and Front-Facing Verification
To eliminate the demerit insulation loophole, the automated infrastructure must transition toward dual-lens front-and-rear photography coupled with automated driver facial matching protocols, matching practices utilized in stricter jurisdictions internationally. This shifts the legal liability directly to the driver abstract, introducing license suspensions and insurance adjustments into the risk equation.
Transition to Uniform Yellow Phase Standardization
Municipalities must audited and extend yellow signal phases by a minimum of 0.5 to 1.0 seconds at intersections showing anomalous ticket volumes. Documented case studies in transport engineering prove that optimizing yellow light windows reduces red-light violations by over 50 percent almost instantly, isolating willful, dangerous violators from drivers caught in engineered dilemma zones.
The metrics compiled by the Calgary Police Service demonstrate that while automated cameras excel at recording non-compliance, they are fundamentally limited in their capacity to cure it. True systemic safety requires replacing a reactive $405 financial mechanism with proactive infrastructure optimization.